Load Models with Performance Testing using Gatling
Tue Aug 01 2023
Noob Tester: Load testing in the cloud with autoscaling seems unnecessary. What’s your view?
Pro Tester: IMO, Load testing helps to optimise performance and improve reliability by simulating different loads and fine-tune scaling.
Noob Tester: Okay, what else?

Pro Tester: Load testing reduces costs and strengthens resilience by identifying inefficiencies and ensuring stability during scaling events.
Noob Tester: Alright, I’m intrigued. What load models can we use?
Pro Tester: In the upcoming sections, we’ll explore load models that simulate real-world scenarios, enhancing our load testing efforts.
Noob Tester: Looking forward to it. Let’s unlock the true potential of our application in the cloud.
Getting to load model, by definition A load model is a description of the various expected levels of load on a system/application, which is the basis for specifying and executing performance tests. In this blog, we will walkthrough over different load models that can be preferred in your next performance test as per your application real-time scenario. Each load model will be discussed with its use case, graphical view and Gatling code snippets to simulate.
Exponential Load Model
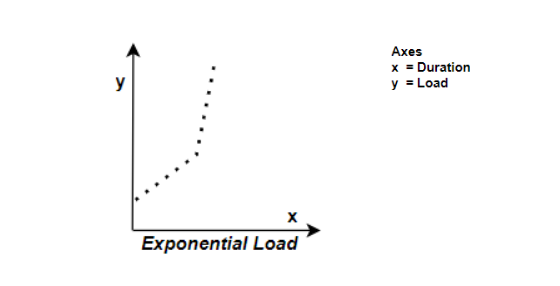
In this model, the rate of growth continuously accelerates (a compounding growth), resulting in a steep upward curve and rapid load expansion. Load on the system/application increases exponentially over time. This type of load model is used to simulate scenarios where the load on the system keeps on growing.
Use Case
Let’s take social media with a post getting viral, the number of users accessing the platform will increase exponentially as more users start sharing and get engaged with that content/platform. The load gets increased exponentially over time (steep upward curve) as users get engaged.
Graphical View
Gatling Code Snippet
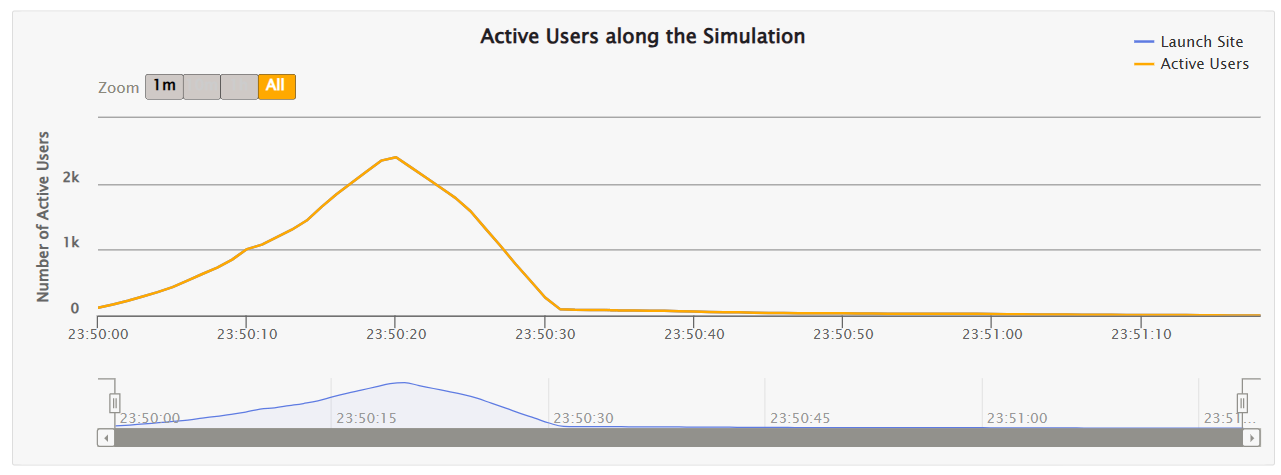
scn.inject(
 nothingFor(5 seconds), //Start with a delay
 atOnceUsers(50), //Initial add 50 users
 rampUsers(50) during (1 seconds), //Ramp up 50 users over 1 seconds
 rampUsers(100) during (2 seconds), //Ramp up 100 users over 2 seconds
 rampUsers(200) during (3 seconds), //Ramp up 200 users over 3 seconds
 rampUsers(400) during (4 seconds), //Ramp up 400 users over 4 seconds
 rampUsers(800) during (5 seconds), //Ramp up 800 users over 5 seconds
 rampUsers(1600) during (6 seconds), //Ramp up 1600 users over 6 seconds
)
Gatling Sample Graph
Logarithmic Load Model
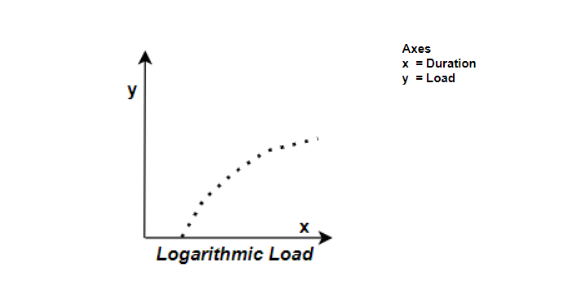
In this model load increases rapidly in the beginning, resembling exponential growth. However, as time progresses, the rate of increase gradually slows down, following a logarithmic progression. While the growth becomes slower, it never reaches a constant flat line. This model is designed to mimic real-world user activity patterns, where there's an initial surge in load, but it gradually tapers off over the period of time.
Use Case
Threads from Meta was recently launched where the Sign Up activity was slow initially then in some time later it got increased rapidly and after a while user Sign Up got reduced/tapers off (Most of the users Signed Up).
Graphical View
Gatling Code Snippet
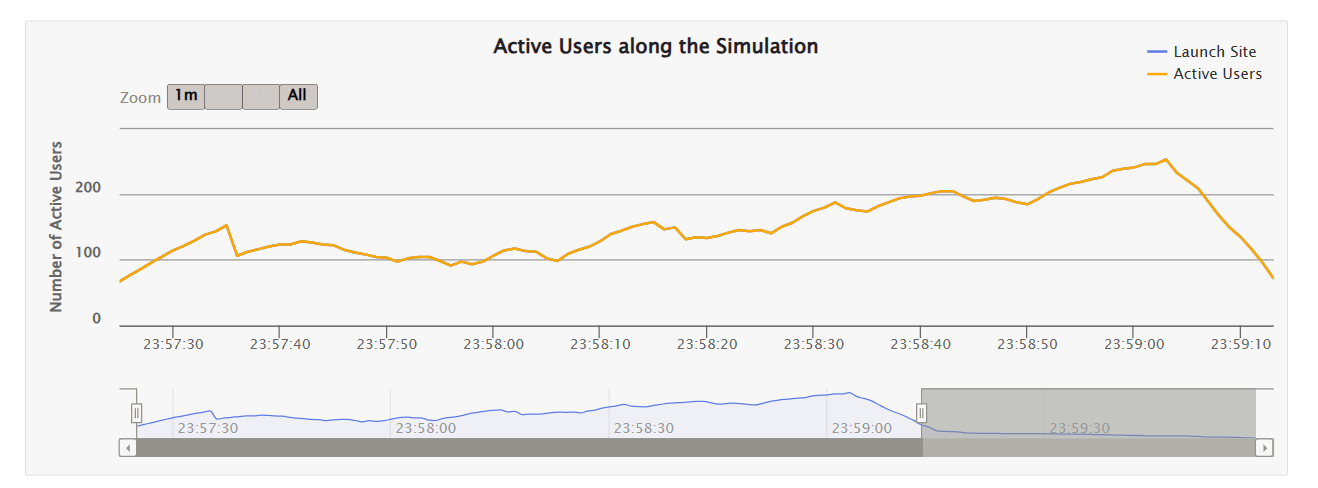
scn.inject(
 nothingFor(5 seconds), //Start with a delay
 atOnceUsers(50), //Initial add 50 users
 rampUsers(100) during (10 seconds), //Ramp up 100 users over 10 seconds
 rampUsers(200) during (20 seconds), //Ramp up 200 users over 20 seconds
 rampUsers(400) during (30 seconds), //Ramp up 400 users over 30 seconds
 rampUsers(800) during (40 seconds), //Ramp up 800 users over 40 seconds
)
Gatling Sample Graph
Constant Load Model
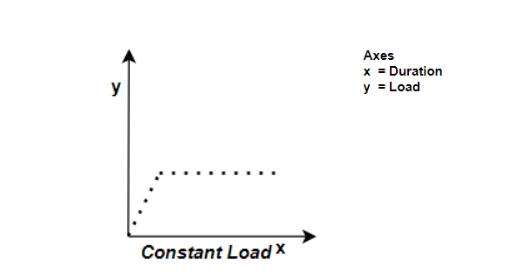
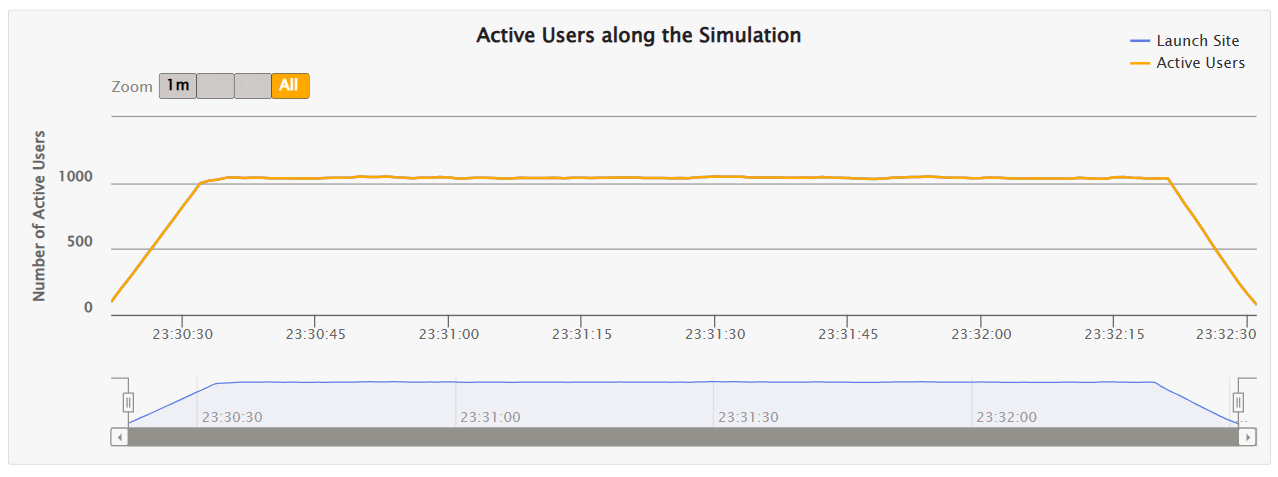
A constant number of virtual users (load) or requests are simulated throughout the test duration. This helps to measure how the system performs under a steady load.
Use Case
Let’s consider some non-critical Customer Support applications, where a group of support assistants will login at 8 in the morning and begin their day working with clients till evening 6 on a regular basis. Here, the support assistants (constant load) will be using the application throughout the day to handle client enquiries and requests.
Graphical View
Gatling Code Snippet
scn.inject(
 constantUsersPerSec(100) during (10 minutes) // Constant load of 100 users per second for 10 minutes
)
Gatling Sample Graph
Step Load Model
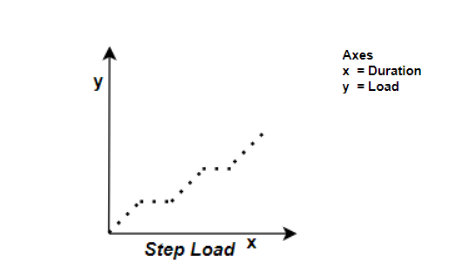
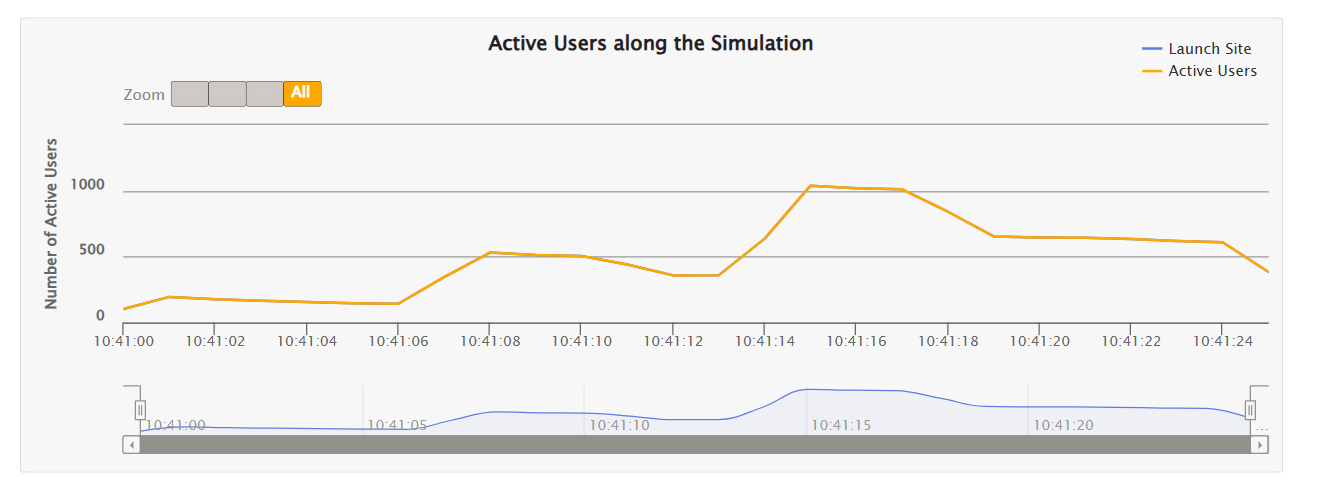
Load is gradually increased by adding virtual users or requests in predefined steps like, initially it starts with 100 then increases to 200, 300 and so on. This helps to evaluate the system performance and scalability as the load increases.
Use Case
Will take Learning portals, initially the course will be accessed by a set of users and as day passes on, more and more users will join the course and resume their day to day learning along with the existing users for a period of time.
Graphical View
Gatling Code Snippet
scn.inject(
 nothingFor(5 seconds), //Start with a delay
 rampUsers(200) during (2 seconds), //Ramp up 200 users over 2 seconds
 nothingFor(5 seconds), //Delay between steps
 constantUsersPerSec(200) during (2 seconds), //Maintain a constant load of 200 users per second for 2 seconds
 nothingFor(5 seconds), //Delay between steps
 rampUsersPerSec(200) to 500 during (2 seconds), //Ramp up from 200 to 500 users per second over 2 seconds
 nothingFor(5 seconds) //End with a delay
)
Gatling Sample Graph
Spike Load Model
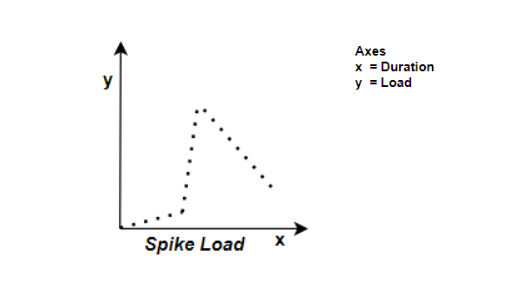
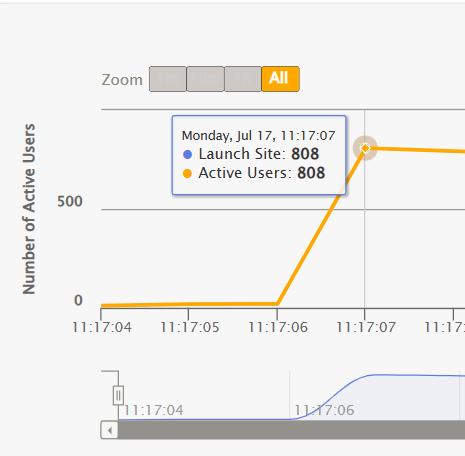
A sudden and significant increase in load is applied to the system for a short period of time, reaching much higher level than the normal operating load. It is used to simulate unexpected surges in user activity that can happen in real-world scenarios and also this model helps to assess how the system handles sudden spikes and whether it can scale up quickly.
Use Case
Will consider Education Board sites or University sites, where they get a sudden spike with a large group of users accessing during the first few hours of the results getting released and later it gets back to normal.
Graphical View
Gatling Code Snippet
Gatling v3.7.0 (stressPeakUsers is available)
scn.inject(
 constantUsersPerSec(10).during(3 seconds), //Constant users of 10 per sec during 3 seconds
 stressPeakUsers(800).during(1 seconds) //stressPeakUsers to 800 suddenly during 1 second
)
Lower versions (stressPeakUsers is not available)
scn.inject(
 nothingFor(5 seconds), //Start with a delay
 rampUsers(100) during (10 seconds), //Ramp up the load with 100 users over 10 seconds
 constantUsersPerSec(100) during (10 seconds), //Maintain a constant load of 100 users per second for 10 seconds
 rampUsersPerSec(100) to 1000 during (10 seconds), //Ramp up the load from 100 to 1000 users per second over 10 seconds
 constantUsersPerSec(1000) during (1 minute), //Maintain a constant load of 1000 users per second for 1 minute
 nothingFor(10 seconds) //End with a delay
)
Gatling Sample Graph
Stress Load Model
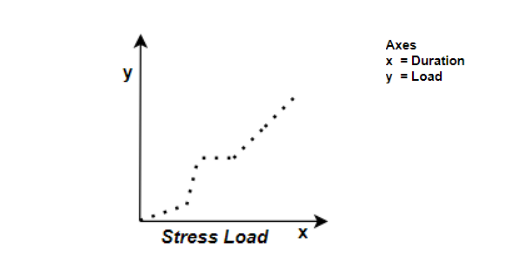
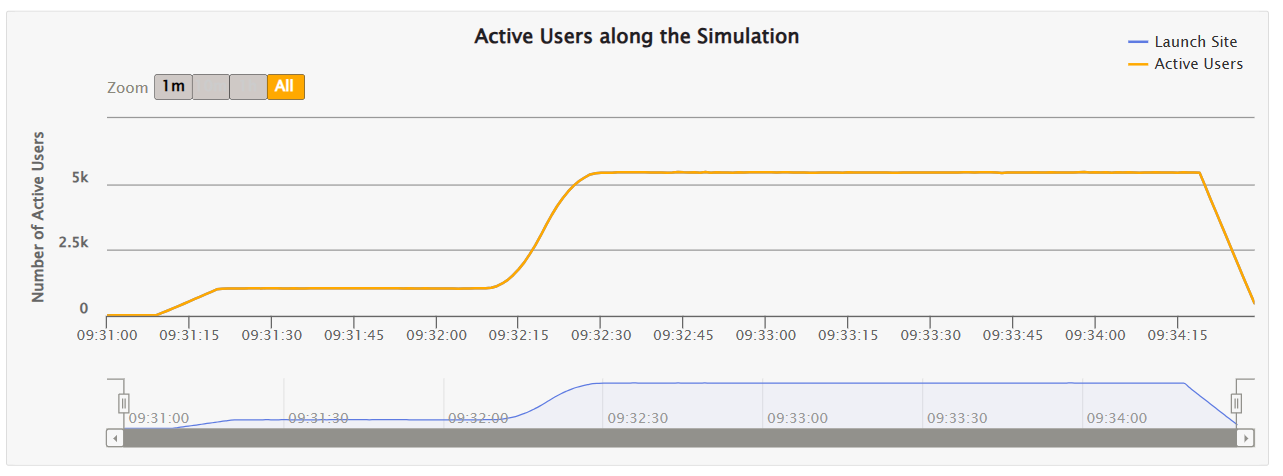
Here the system/application under test, is pushed to its limits by applying a load that exceeds the system's expected capacity, to determine its breaking point or point at which the system starts to degrade or fail. It helps in determining the system's maximum capacity and uncovering potential performance bottlenecks.
Use Case
News websites are tested with this model, where these sites with some hot live news get unexpected user loads, pushing the system’s expected capacity to reach breaking point and later recover.
Graphical View
Gatling Code Snippet
scn.inject(
 nothingFor(5 seconds), //Start with a delay
 rampUsers(100) during (10 seconds), //Ramp up the load from 0 to 100 users over 10 seconds
 constantUsersPerSec(100) during (1 minutes), //Maintain a constant load of 100 users per second for 1 minutes
 rampUsersPerSec(100) to 500 during (10 seconds), //Ramp up the load from 100 to 500 users per second over 10 seconds
 constantUsersPerSec(500) during (2 minutes), //Maintain a constant load of 500 users per second for 2 minutes
 nothingFor(10 seconds) //End with a delay
)
Gatling Sample Graph
Soak Load Model
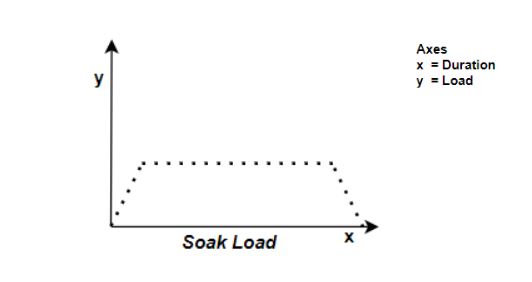
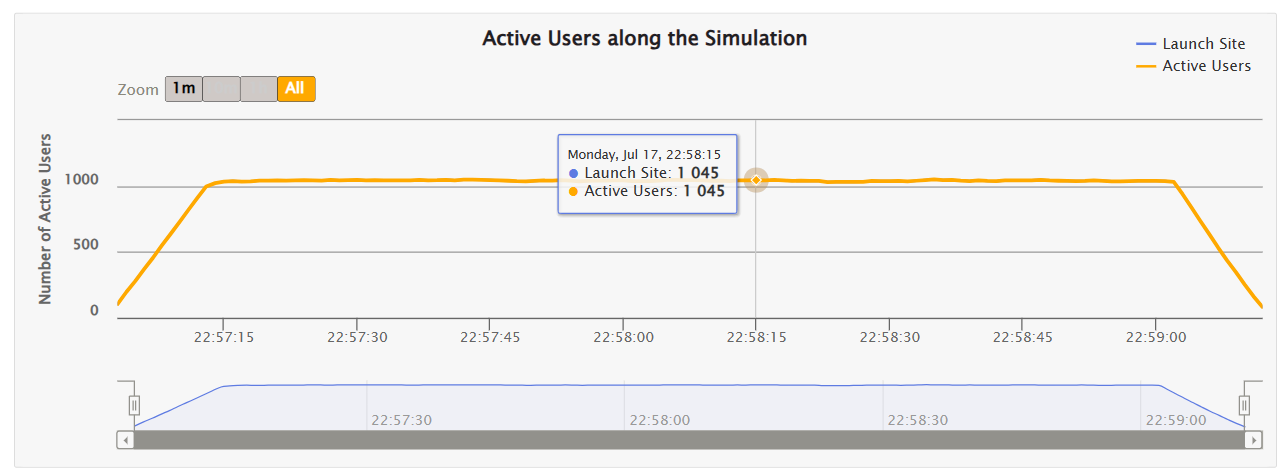
This model involves applying a consistent load on the system for an extended period, typically several hours or even days (Endurance testing). The purpose is to evaluate the system's stability and performance over an extended duration and identify any memory leaks, resource exhaustion, or other issues that may occur over time.
Use Case
Mission critical applications (Aviation sector, Finance sector, etc) have to work flawlessly without any performance issues over the expected duration of time and process the load/requests within the system.
Graphical View
Gatling Code Snippet
scn.inject(
 nothingFor(5 seconds), // Start with a delay
 constantUsersPerSec(100) during (1 hour), // Constant load of 100 users per second for 1 hour
 nothingFor(10 seconds) // End with a delay
)
Gatling Sample Graph
Burst Load Model
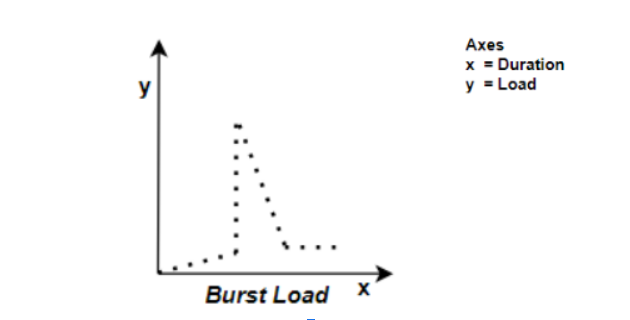
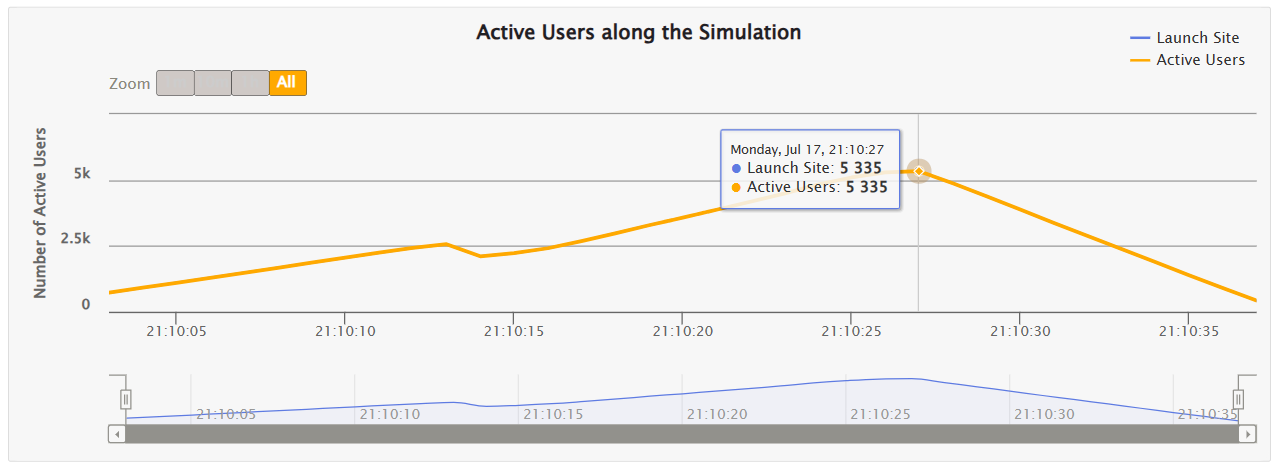
It simulates bursts of user activity followed by normal load periods and there can be multiple bursts in a session. This pattern gets repeated throughout the test duration and it helps in assessing the system’s ability to handle varying loads over time (rapid increases and idle periods).
Use Case
Let’s take any ecommerce site where it experiences intermittent peak loads during its half price promotional sale than its normal sale. Site has to handle those situations avoiding business loss.
Graphical View
Gatling Code Snippet
scn.inject(
 nothingFor(5 seconds), // Start with a delay
 atOnceUsers(500), // Initial burst of 500 users
 constantUsersPerSec(200) during (10 seconds), // Constant load of 200 users per second for 10 seconds
 rampUsersPerSec(100) to 500 during (5 seconds), // Ramp up from 100 to 500 users per second in 5 seconds
 constantUsersPerSec(500) during (10 seconds), // Constant load of 500 users per second for 10 seconds
 nothingFor(10 seconds) // End with a delay
)
Gatling Sample Graph
Conclusion
A realistic load model is the core of a solid performance test. So, pick the load model or design your own load model that simulates your application real-time load, then with simulation understand its performance behaviour before getting released to end users.
We would love to hear from you! Reach us @
info@techconative.com

