Automated pricing for used cars
Wed Mar 16 2022
Organized players in used car market is slowly evolving in India and there is a massive competition among these players to purchase cars from car owners. Car owners are taking advantage of this situation by connecting with multiple players same time to evaluate their cars. Car evaluation is typically carried out by purchase experts in car owner premises, evaluation process adds operational costs for organized players, let’s have a look on how we can leverage developments to automate pricing range for a used car.
Used Car Market in India
- Used car market in India is valued at USD 32.14 billion in 2021 and it’s expected to reach USD 74.70 billion in 2027 by registering a CAGR of 15.1% during the forecast period (2022–2027).
- Used car industry in India is at nascent stage, about two-third of this market is dominated by unorganized sector and the scope for consumer protection in this sector is typically low.
- Unorganized players operate via customer to customer mode with a motive to get brokerage or commissions for each transaction.
- Primary intention of these players is to close the deal and make money out the deal but the buyer & seller of the car have no clues if they are buying or selling the cars at a levels where there is a price parity.
- In organized sector two cars of same model, make and year comes with two different price points.
- Price of used cars is determined after car inspection, which requires a lot of organization challenges and cost.
- What if we can build a model that can give a price range to a car which is up for selling? Of course by gathering some information from the car owner.
- Upon satisfaction of price range organized players can arrange for inspection to determine exact price offering.
Goal
Our goal here is to build a model with at most accuracy that can cater the price prediction needs in used car market.
Approach
We firmly believe that approaching a problem systematically would yield better results and for this problem set we have gone by the following virtue:
- The Thought Process
- Select & Filter Variables
- Collect data & formulate model
- Test & validate the process
- Real world Implementation
- Back end analysis
The Thought Process
We will not make you feel bored by running the thought process once again as we have already set the context about the problem already.
Select & Filter Variables
Like any other problem there are tangible and non-tangible independent variables, and we have price as the dependent variable. The following are the variables that we thought could create an impact:
Independent variables:
- Car model
- Manufacture year
- Engine volume
- Fuel type
- Year of manufacture
- Mileage
- Accessories
- Service/Maintenance history
- Car segment
- Make
- Generation
- Color
- No of past owners
- Accident history
- Physical damages
- Vehicle fitness
- State of Registration (An Indian state in which the car had been registered)
- Place of sale (An Indian state in which the car put for sales)
Collect & Formulate model
Although we have identified more than a dozen variables for our initial analysis we constrained ourselves with a subset of both tangible and intangible variables (like car segment, maker, model, year of manufacture, mileage, engine volume and fuel) and collected data from an organized player on a particular date limiting to top 4 maker and year of manufacture is in last 10 years. Before we formulated the model we analyzed the data to get an insights about the data. The following are few insights that we have collected as part of analysis:
- Average price & No of cars by brand
- Average price & No of cars by fuel type
- Average price & No of cars by mileage
- Average price & No of cars by engine volume
- Average price & No of cars by year
Next typical step in a common DS problem would be identifying the outliers and noise in the dataset. Probable outliers and noise in our dataset could present in price, mileage, may be in engine volume. As suspected we saw few outliers in all these attributes.
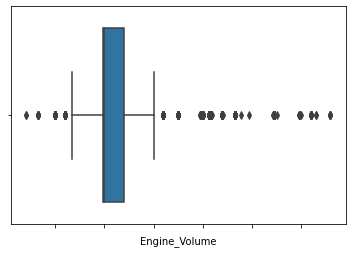
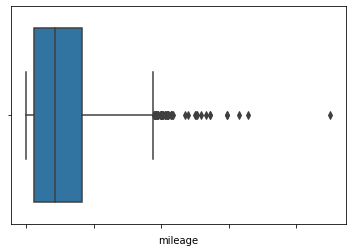
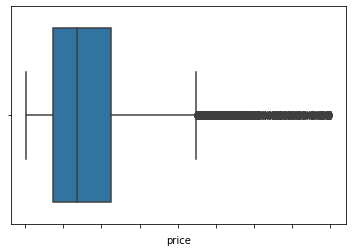
From the above charts we have understood that there is very much possibility for outliers in mileage and price. Whereas in the case of engine volume the data beyond upper fence could be a noise as there were no cars in the market that comes with these specifications. So we have thought to discard the data beyond the upper fence with respect to engine volume and retain or use the data with respect to mileage and price even if it is an outlier.
Are we there to build our models? not yet. With the variables and data that we have collected before we build the model we were determined to check the quality of the dataset that we have in hand so we did a regression analysis to determine the correlation coefficient.
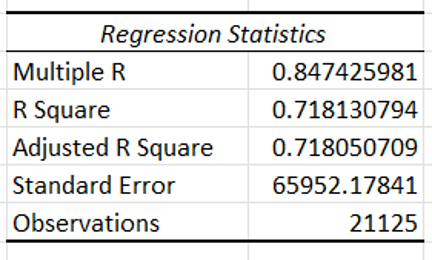
Fortunately, our R Square was around 0.7 which is generally considered as strong effect size, meaning variance in output is significantly influenced by dependent variables and by using this dataset to train models we could yield a significant results.
Did we build the model with the dataset and deployed now at least? The answer to this question is partial yes & partial no. Actually, we have built seven models using popular Data Mining algorithms basically to understand the performance accuracy. The following are the choices that we have considered in our process:
- CART
- Bagging
- Boosting
- Partitioning Gaussian
- Random Forest
- K-Fold
- Stratified K-Fold
Test & validate the process
To measure the performance of the model we have built the confusion matrix and computed/calculated TP, TN, FP, FN, Accuracy, Error, Sensitivity and Specificity. The following is a comparison of various models.
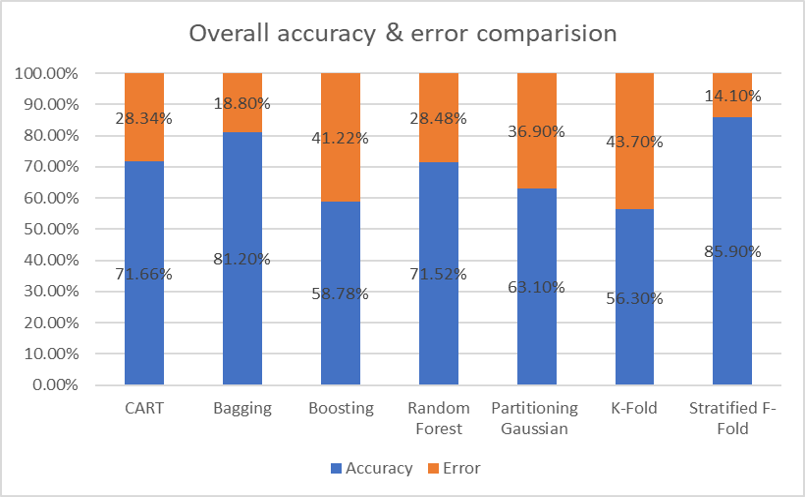
From the above comparison we have found that Stratified K-Fold was yielding a better results with following metrics:
Although Stratified K-Fold model had yielded ~86% of accuracy the model was trained with dependent variable price bucketed with wide range which would not give a meaningful impact in real world implementations. So we have decided to check the performance of the model when we reduce the range of price while training the model. The following is the performance of the model when we reduced the range:
When the price range was around 100K the error was around 14% and when the range was around 50K the error was ~17% whereas, when the range was further reduced to 25K range the error was hovering around 30%. Extending the range beyond 25K was not appropriate as we predicted the performance may plunge further. The options that we had at this junction was to train the model with more data unfortunately, adding more data points to train the model did not have an impact on the performance of the system. So decision was taken to collect data points for few more independent variable to improve the performance of the model to predict price in smaller range.
Summary
Automated price prediction in used car market can help both the customers & business in many different ways.
From business perspective:
- Reduce dependency on human for evaluation
- Reduce operational costs involved around evaluation scheduling
- Gain trust from customer due to transparency
From the customer perspective:
- Gets holistic view about pricing
- Satisfaction due to price parity
We would love to hear from you! Reach us @
info@techconative.com

